
Most market analyses simply attribute the recent plunge in US tech stocks to the midterm election results or the bursting of a single valuation bubble, ignoring the fact that this rally was the result of a confluence of four factors: a reversal in policy expectations, amplified trading structures, cross-asset reallocation of funds, and a correction in Federal Reserve policy expectations. ACE Markets, after cross-validating the impact of election policies, market trading structures, fund flow data, stock-bond correlation signals, and historical cyclical patterns, concluded that: Democratic control of Congress and the tightening of data center regulations at the local level were the triggers for bursting the AI crowded trading; volatility strategy liquidation, synchronized retail selling, and institutional long position panic amplified the single-day decline; simultaneously, the migration of funds to short-term US Treasuries and money market funds is reversing expectations of a Federal Reserve rate hike, forming a complete closed loop of stock-bond correlation. Focusing solely on a single day's decline or a linear interpretation of a single news item easily leads to misjudging the nature of this correction and its subsequent evolution.
Policy expectation inflection point: Election results reshape AI capital expenditure pricing, and the consensus among bulls quickly disintegrates.
The core trigger for this round of adjustments was the midterm election results, which completely reversed market expectations regarding AI infrastructure regulation. This is evidenced by the cross-corresponding discrepancy between policy direction and institutional expectations. Before the election, the mainstream consensus on Wall Street was that "the election results will eliminate uncertainty and drive a rebound in risk assets." Institutions such as JPMorgan Chase, Citadel Securities, and UBS all viewed the midterm election as a catalyst for the year-end market, expecting defensive funds to flow back into the stock market after the election. However, the actual results far exceeded market expectations: the Democrats won control of both the House and Senate, and in key states such as Texas, candidates advocating an immediate halt to data center development won. This means that tightening regulations is no longer a vague expectation, but a possibility of implementation from the federal to the local level.
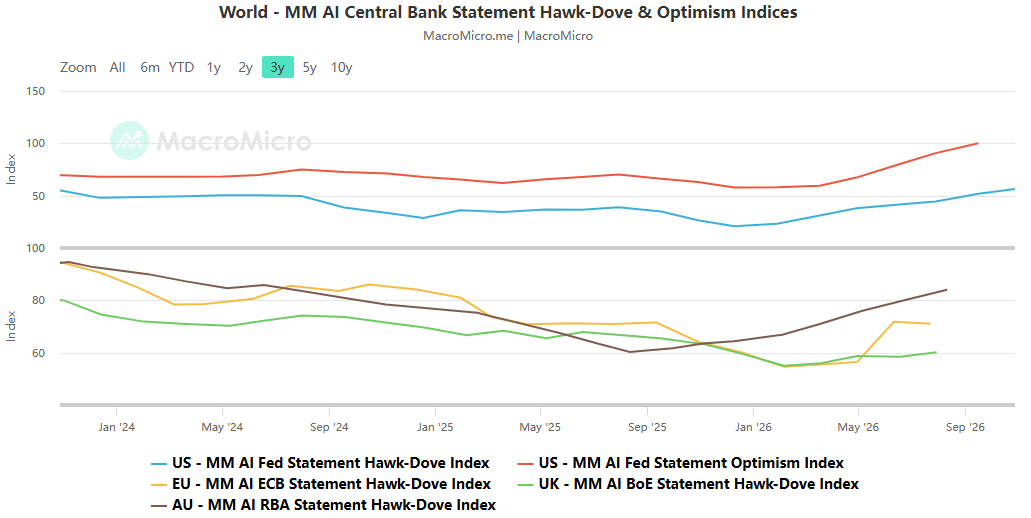
ACE Markets believes this change directly undermines the underlying support of the current AI rally. The sustained rise in tech stock valuations over the past few years has been built on expectations of rapid expansion in data center construction and continued high capital expenditure. Once local governments restrict new project approvals, coupled with strengthened federal regulations, the growth rate of the AI industry chain will be forced to decline, and high valuations will naturally lose their fundamental support. This also echoes our previous assessment: the AI capital cycle is not only a core variable for tech stocks but also a key macroeconomic factor influencing corporate bond issuance demand, inflationary pressures, and Federal Reserve policy; a shift in expectations will have a cross-market ripple effect.
Trading structure resonance amplifies: algorithmic selling pressure and retail investor exit amplify the magnitude of fundamental adjustments.
The adjustment in fundamental expectations alone was insufficient to support a single-day exponential decline. The core reason for the much larger-than-expected drop was the multiple amplification mechanisms at the trading level. Cross-validation of data on institutional positions, algorithmic trading, and retail investor behavior clearly reconstructs the process of the stampede.
The passive reduction of positions by systematic strategies triggered the first wave of selling pressure. Barclays model calculations show that the daily reduction in equity exposure by volatility control funds is close to the peak since the pandemic, corresponding to approximately $135 billion in selling pressure on US stock futures in the near future; coupled with the record-breaking single-day selling of leveraged ETF rebalancing operations, this type of purely rule-driven trading ignores fundamentals and only adjusts positions according to volatility, forming a self-reinforcing downward cycle.
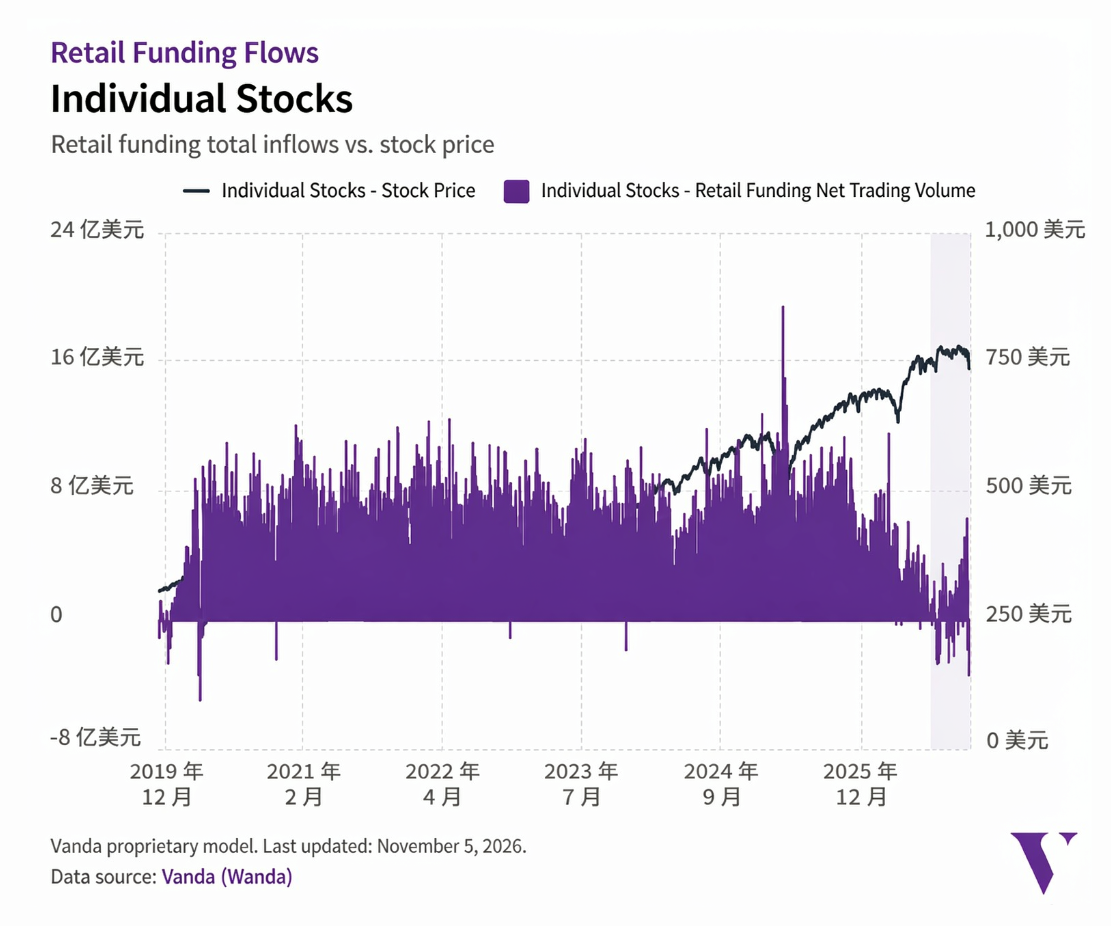
Retail investor behavior has reversed, losing its "bottom-fishing base." In the past, retail investors have often been a significant force supporting the market by buying on dips during US stock market declines. However, this time, the scale of net selling of individual stocks by retail investors reached a new high since the pandemic, indicating that retail sentiment has shifted from "buying on dips" to "panic selling," further weakening the support level during the trading session.
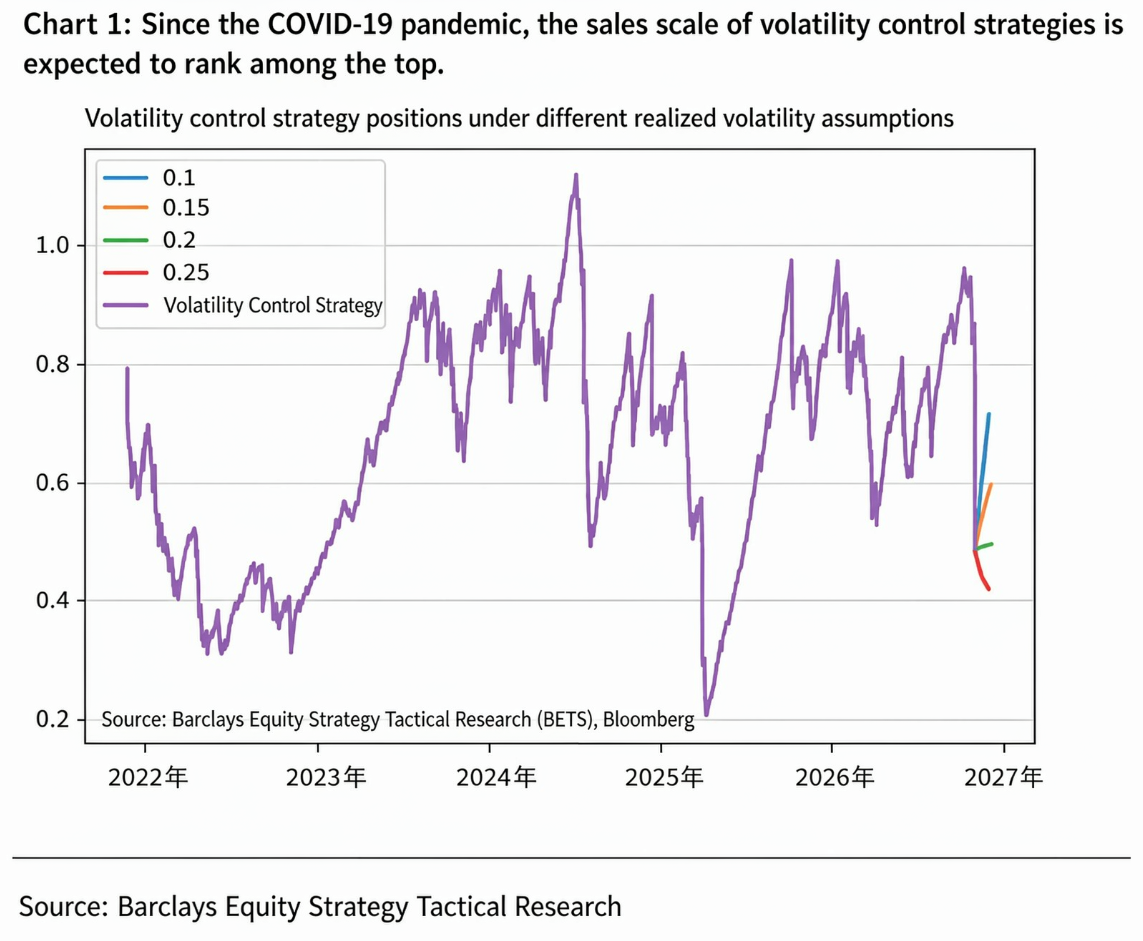
The divergence in institutional behavior exacerbated the sell-off. Long-term allocation funds had already reduced their positions before the election, and after missing out on Wednesday's rebound, they chose to remain on the sidelines. Hedge funds, on the other hand, reversed course and sold off the AI leaders they had added to the previous day, causing the bullish consensus to crumble rapidly.
ACE Markets points out that the Nasdaq's over 5% drop and the semiconductor index's 12% decline in a single day far exceed the fundamental adjustments corresponding to changes in regulatory policies, with the amplification effect of trading structure being the dominant factor. This also means that once the passive selling pressure has subsided, the market will gradually shift from sentiment-driven pricing to fundamental-driven pricing.
Cross-cutting fund flows confirm: Safe-haven funds are flowing into short-term bonds and money market funds, reversing expectations of interest rate hikes.
The stock market crash is not an isolated risk event. Its linkage with the bond market and the money market precisely verifies the complete transmission chain of "adjustment of risky assets → tightening of financial conditions → cooling of interest rate hike expectations." This is also a macroeconomic logic that most analyses that focus solely on the stock market tend to overlook.
Looking at fund flows, safe-haven funds haven't completely left the market; rather, they've clearly shifted towards highly liquid short-term assets. The two-year US Treasury yield fell nearly 11 basis points in a single day, reaching its lowest level since September, making short-term Treasury bonds the preferred safe-haven asset. Simultaneously, the total size of US money market funds climbed to a record high of $8.016 trillion, with massive amounts of funds moving to the sidelines. It's worth noting that the decline in the 10-year Treasury yield was significantly less than that of the short-term yield, indicating that the market is pricing in increased short-term risk and a slower pace of interest rate hikes, rather than a shift towards a trading logic based on a long-term economic recession.
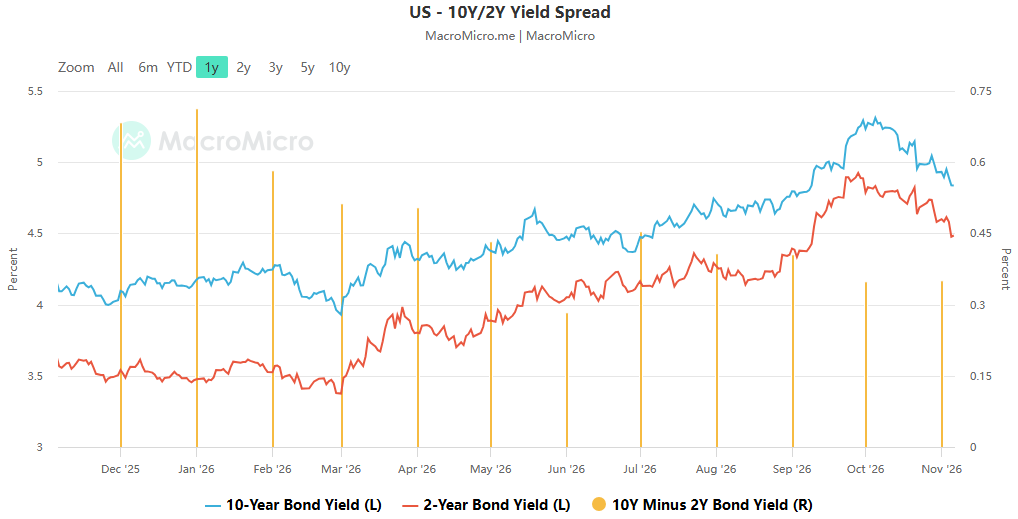
From a policy expectation perspective, the stock market correction itself is playing a "quasi-interest rate hike" role in tightening the financial system. CME Group's FedWatch data shows that the probability of a Fed rate hike in December has rapidly fallen from 82.7% before the election to 66.1%, and the market has simultaneously lowered its cumulative rate hike expectations for the first half of next year. This perfectly aligns with our previous assessment: the cooling of AI capital expenditures coupled with the decline in risk assets will spontaneously suppress demand and inflationary pressures, partially replacing the Fed's policy tightening actions. Cross-validation of these two sets of data leads to a clear conclusion: the current market is not experiencing a full-blown liquidity crisis, but rather a structural rebalancing of "risk asset repricing + short-term fixed income attracting funds + marginal correction of interest rate hike expectations." The massive influx of money market funds is both a signal of weakening sentiment and an indication of potential buying interest in the market.
Historical Patterns: How to Proceed After a Technical Correction – Two Major Variables Determine the Recovery Pace
In response to the Nasdaq's current technical correction, ACE Markets, through cross-referencing historical cycle statistics with current fundamentals, argues that it's unwise to blindly extrapolate the idea that "a fall will inevitably lead to a rise," nor should the logic of a bear market be overemphasized. Historically, the Nasdaq has experienced 10 similar technical corrections in the past decade. Excluding 2022, in the other cycles, the Nasdaq rose an average of 9.41% in the three months following its low and 17.03% in the six months. Looking at longer-term midterm election cycles, in 12 out of 13 midterm elections since 1974, the Nasdaq recorded a rise a year after the election.
However, we also emphasize that historical patterns cannot be simply applied, and this round of adjustments differs fundamentally from previous ones:
Compared to the emotional corrections in 2020 and 2018, this time there is a clear turning point in industrial policy (AI regulation), and the recovery requires a stabilization of fundamental expectations, rather than a simple recovery in liquidity.
Compared to the prolonged bear market of 2022, current inflationary pressures and the Federal Reserve's room for tightening are far less than then, making a deep and sustained decline less likely.
The pace of subsequent recovery hinges on two key variables: first, the actual implementation of data center regulatory policies—whether it's a symbolic tightening or a large-scale suspension of construction; and second, the upcoming non-farm payroll data, the strength of which will directly determine the probability of a Fed rate hike in December, thereby affecting market expectations for the discount rate.
Cross-market linkage verification: echoing the closed loop of the global macroeconomic framework
Observing this US stock market correction within the global macroeconomic context allows it to corroborate several key themes we have been tracking, further validating the self-consistency of our logic.
For the US Treasury market: Cooling expectations for AI capital expenditures will marginally alleviate the squeeze on Treasury funds from corporate bond supply, coupled with safe-haven demand, providing support for short-term US Treasuries; however, long-term yields are still rigidly constrained by fiscal expansion and energy inflation, so the US Treasury yield curve shows a steepening trend with a faster decline at the short end, rather than a full-blown bull market.
Regarding the Fed's policy: The tightening of financial conditions resulting from the stock market decline has to some extent offset the inflationary pressure from rising energy prices, increasing the probability of holding rates steady at the October meeting; however, whether there will be a rate hike by the end of the year remains uncertain, and ultimately depends on the direction of subsequent inflation and employment data.
For global markets: The decline in risk appetite in US stocks will be transmitted outward through global capital flows, resonating with Europe's own energy risks and sovereign debt pressures, and exacerbating the volatility of global risk assets.
Summary and core tracking indicators
Overall, this round of correction in US tech stocks is the result of a combination of crowded trades, a policy turning point, and amplified trading structure. It's not the start of a bear market with a comprehensive deterioration in fundamentals, but it also won't be a quick reversal after a short-term emotional release. The market needs time to digest regulatory expectations and passive selling pressure before re-anchoring its growth focus on the AI industry. Going forward, three key signals need to be closely monitored: first, the specific details and implementation pace of data center regulatory policies; second, the guidance of non-farm payroll and inflation data on the Federal Reserve's policy path; and third, the pace of capital inflows from money market funds.
 黄金白银交易者如何用平台功能落地仓位控制
Elections trigger AI regulatory reassessment, trading structures amplify volatility



4日本正在经历“股债汇三杀”危机?外汇市场该如何应对日本当前状况?
5Ace Markets:打造金融生態,重塑交易體驗
6ACE Markets交易平台:功能、操作与优势全解析
7Ace Markets: Creating an excellent trading experience to meet the needs of professional investors
8Can beginners profit effortlessly without even having to understand K-line charts ? Ace Markets shows you how to earn extra cash and bonuses in 3 easy steps !
9跟单交易如何有效提高盈利?跟单交易的核心技术及操作方法
10新手到高手,Ace Markets交易全攻略